| species | island | bill_length_mm | bill_depth_mm | flipper_length_mm | body_mass_g | sex | year |
|---|---|---|---|---|---|---|---|
| Adelie | Torgersen | 39.1 | 18.7 | 181 | 3750 | male | 2007 |
| Adelie | Torgersen | 39.5 | 17.4 | 186 | 3800 | female | 2007 |
| Adelie | Torgersen | 40.3 | 18.0 | 195 | 3250 | female | 2007 |
| Adelie | Torgersen | NA | NA | NA | NA | NA | 2007 |
| Adelie | Torgersen | 36.7 | 19.3 | 193 | 3450 | female | 2007 |
| Adelie | Torgersen | 39.3 | 20.6 | 190 | 3650 | male | 2007 |
Data Wrangling
February 5 + 10, 2025
Jo Hardin
Agenda 2/5/25
- Tidy data
- Data verbs
What are data?
Tidy data
- each row = a unit of observation (here, a penguin)
- each column = a measure on some variable of interest, either quantitative (numbers with units) or categorical (discrete possibilities or categories)
- each entry contains a single data value; no analysis, summaries, footnotes, comments, etc, and only one value per cell
Definition of datum
The definition of datum can be much broader:
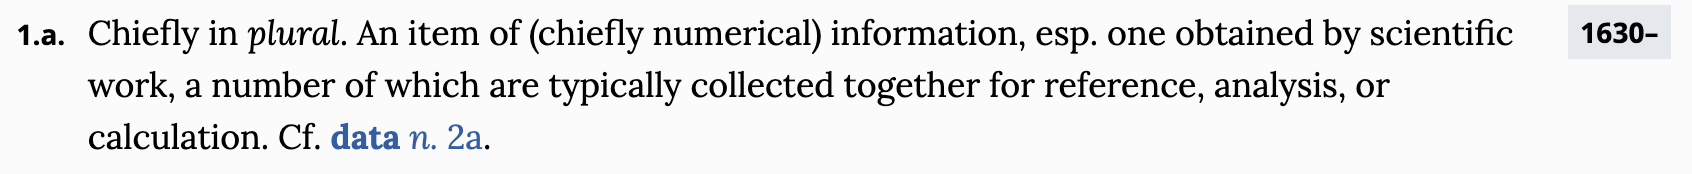
Definition of datum from the Oxford English Dictionary
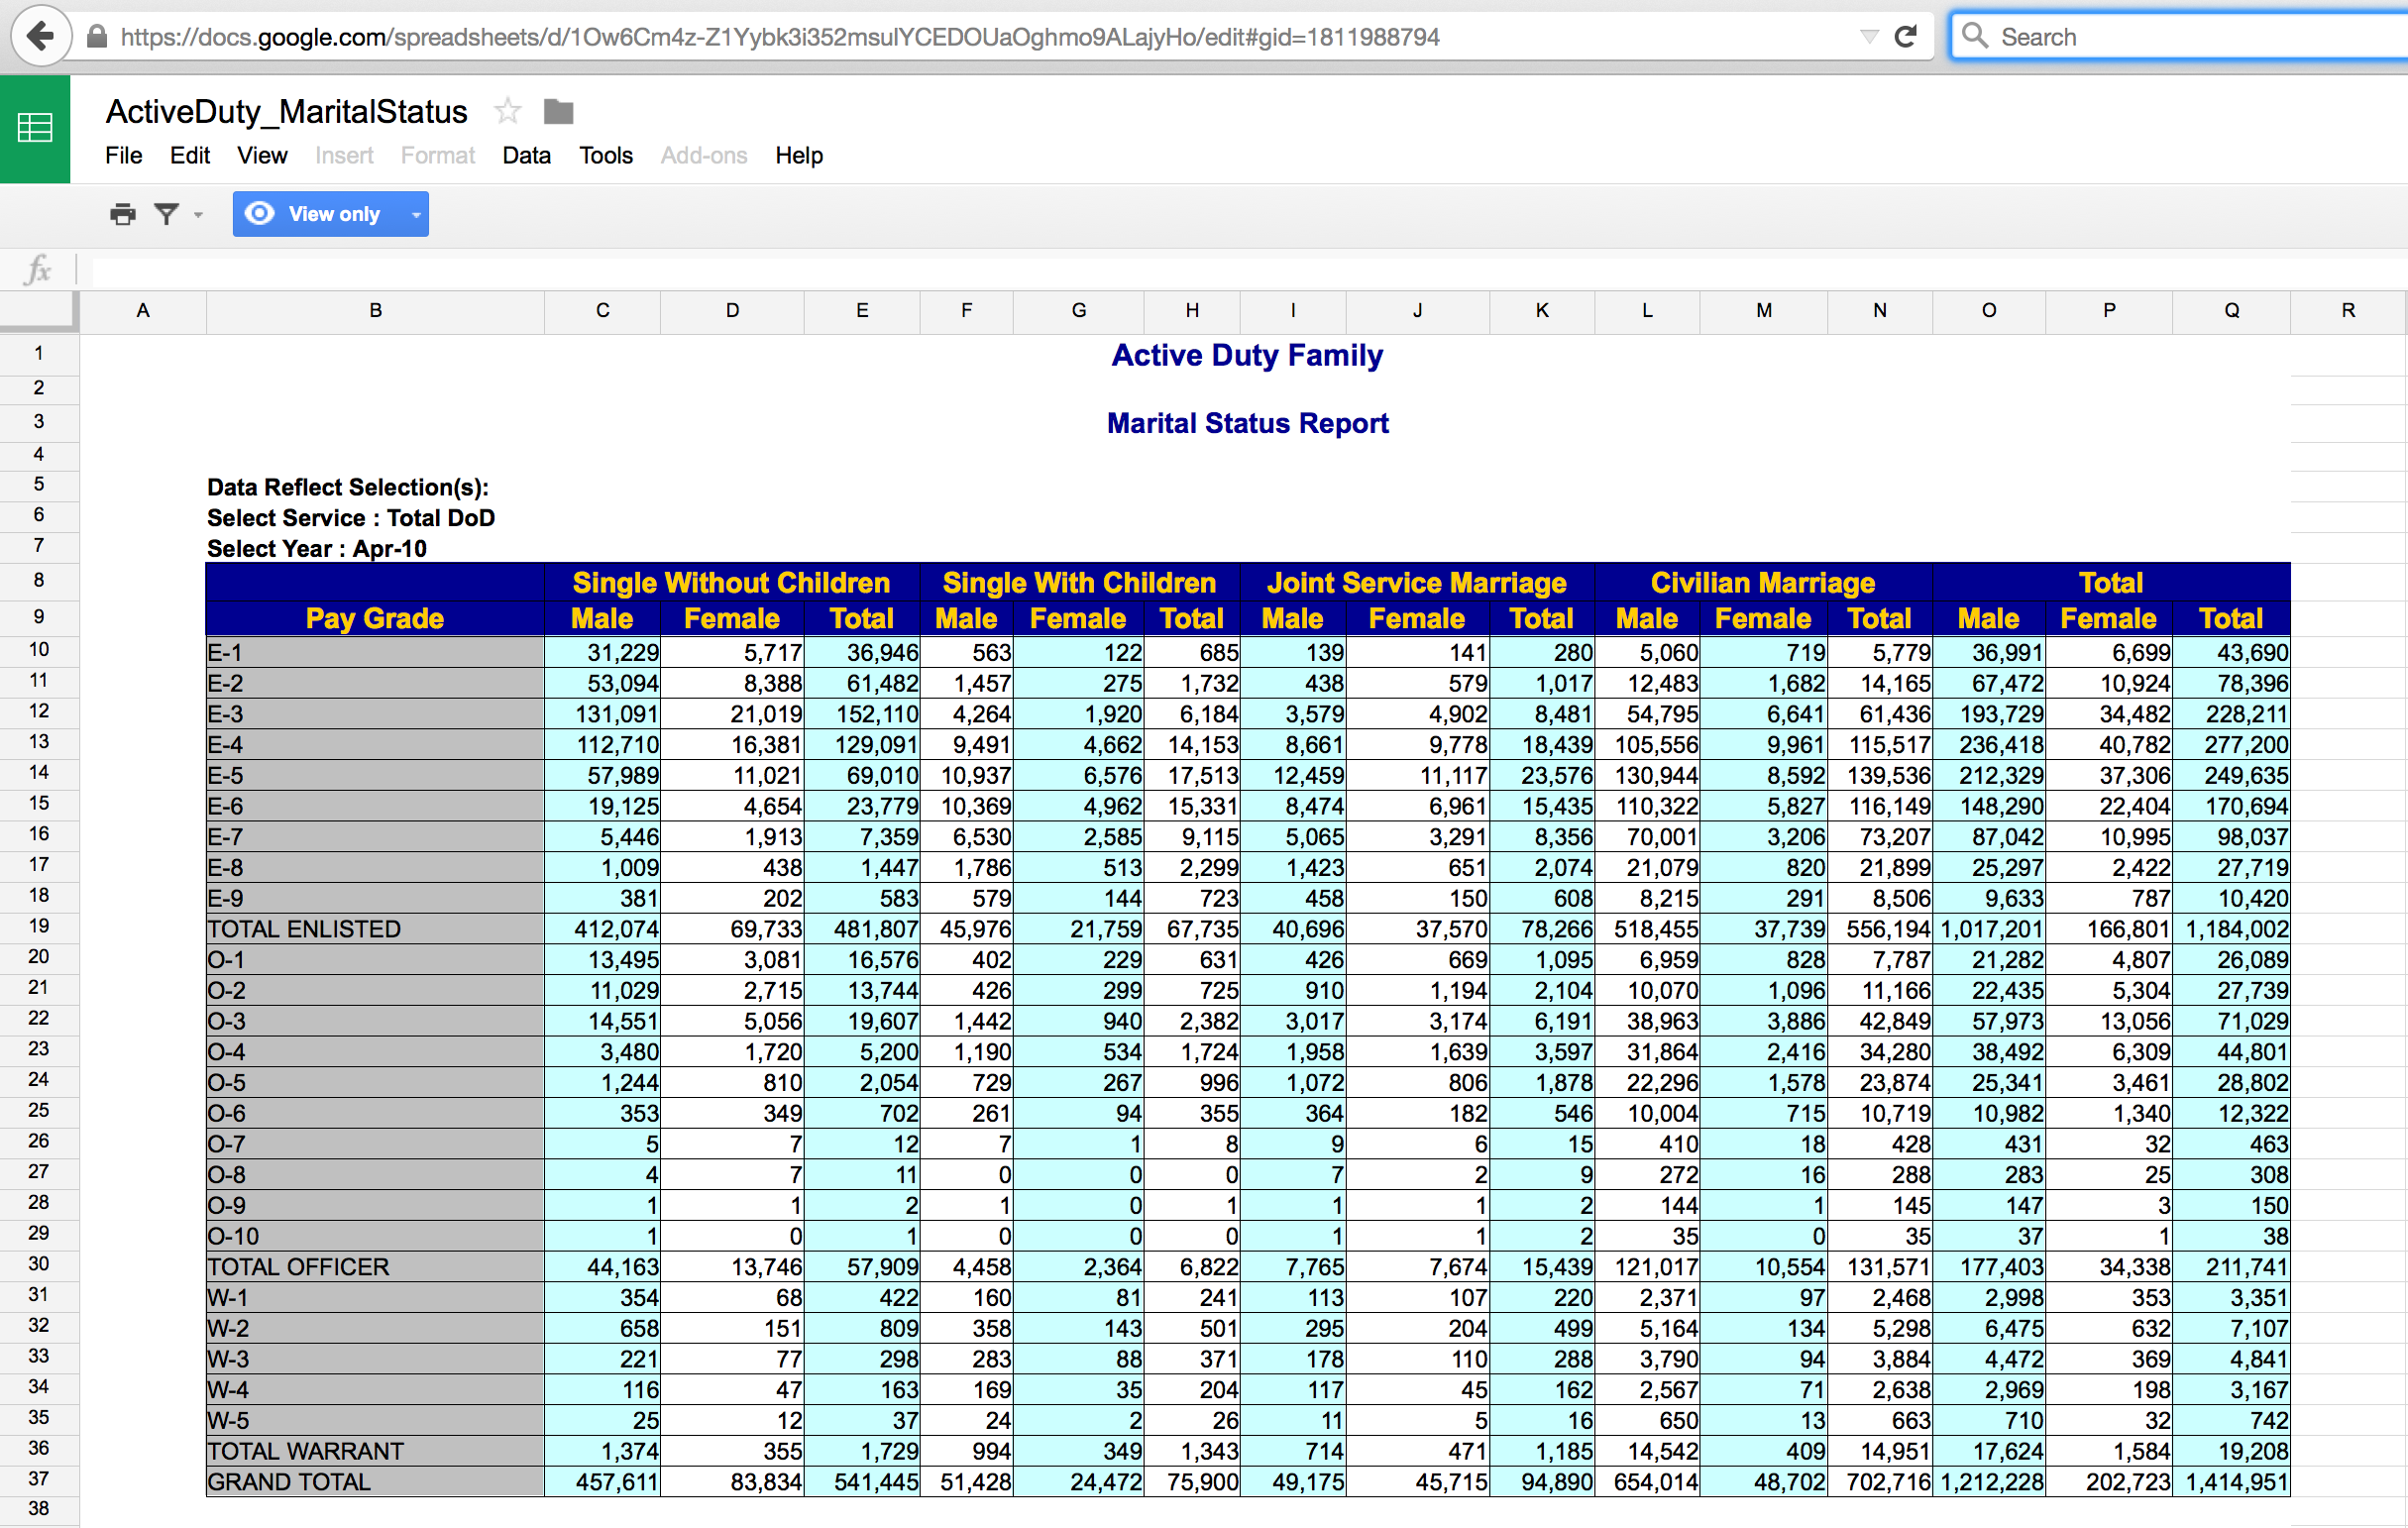
Not tidy – Active Duty Military
The Active Duty data are not tidy! What are the cases? How are the data not tidy? What might the data look like in tidy form? Suppose that the case was “an individual in the armed forces.” What variables would you use to capture the information in the following table?
Tidying data
How would you wrangle each data example into a tidy format?
- the emails in your inbox
- social media texts
- images
- videos
- audio files
Tidy packages: the tidyverse

image credit: https://www.tidyverse.org/.
Verbs
Most data wrangling happens with a set of data verbs. Verbs are functions that act on data frames.
The first argument of each data verb is the data frame.
Some Basic Verbs
filter()∗arrange()select()∗distinct()mutate()∗summarize()∗sample_n()group_by()∗
The most used verbs are denoted with ∗.
(out of) NYC, flights data (2013)
filter()
Allows you to select a subset of the rows of a data frame. The first argument is the name of the data frame, the following arguments are the filters that you’d like to apply
For all flights on January 1st:
Constructing filters
Filters are constructed of logical operators: <, >, <=, >=, ==, != (and some others).
Adding them one by one to filter() is akin to saying “this AND that”. To say “this OR that OR both”, use |.
Practice
Construct filters to isolate:
- Flights that left on St. Patrick’s Day.
- Flights that were destined for Chicago’s primary airport.
- Flights that were destined for Chicago’s primary airport and were operated by United Airlines.
- Flights with flight times more than 2000 miles or that were in the air more than 5 hours.
Solution
- Flights that left on St. Patrick’s Day.
- Flights that were destined for Chicago’s primary airport.
- Flights that were destined for Chicago’s primary airport and were operated by United Airlines.
- Flights with flight times more than 2000 miles or that were in the air more than 5 hours.
arrange()
arrange() reorders the rows: It takes a data frame, and a set of column names (or more complicated expressions) to order by. If you provide more than one column name, each additional column will be used to break ties in the values of preceding columns:
Use desc() to sort in descending order.
select()
Often you work with large datasets with many columns where only a few are actually of interest to you. select() allows you to rapidly zoom in on a useful subset using operations that usually only work on numeric variable positions:
You can exclude columns using - and specify a range using :.
| ABCDEFGHIJ0123456789 |
dep_time <int> | sched_dep_time <int> | dep_delay <dbl> | arr_time <int> | sched_arr_time <int> | |
|---|---|---|---|---|---|
| 517 | 515 | 2 | 830 | 819 | |
| 533 | 529 | 4 | 850 | 830 | |
| 542 | 540 | 2 | 923 | 850 | |
| 544 | 545 | -1 | 1004 | 1022 | |
| 554 | 600 | -6 | 812 | 837 | |
| 554 | 558 | -4 | 740 | 728 | |
| 555 | 600 | -5 | 913 | 854 | |
| 557 | 600 | -3 | 709 | 723 | |
| 557 | 600 | -3 | 838 | 846 | |
| 558 | 600 | -2 | 753 | 745 |
distinct()
A common use of select() is to find out which values a set of variables takes. This is particularly useful in conjunction with the distinct() verb which only returns the unique values in a table.
What do the following data correspond to?
mutate()
As well as selecting from the set of existing columns, it’s often useful to add new columns that are functions of existing columns. This is the job of mutate():
summarize() and sample_n()
summarize() collapses a data frame to a single row based on some function. It’s not very useful yet, but it will be.
sample_n() provides you with a random sample of rows.
| ABCDEFGHIJ0123456789 |
delay <dbl> |
|---|
| 12.63907 |
1 row
| ABCDEFGHIJ0123456789 |
year <int> | month <int> | day <int> | dep_time <int> | sched_dep_time <int> | |
|---|---|---|---|---|---|
| 2013 | 12 | 30 | 1835 | 1804 | |
| 2013 | 2 | 13 | 555 | 600 | |
| 2013 | 2 | 4 | 601 | 600 | |
| 2013 | 4 | 14 | 950 | 955 | |
| 2013 | 11 | 14 | 1253 | 1300 | |
| 2013 | 8 | 30 | 2121 | 2122 | |
| 2013 | 9 | 23 | 1353 | 1400 | |
| 2013 | 5 | 1 | 1106 | 1115 | |
| 2013 | 12 | 21 | 33 | 2359 | |
| 2013 | 4 | 10 | 2232 | 2032 |
1-10 of 10 rows | 1-5 of 19 columns
Practice
Mutate the data to create a new column that contains the average speed traveled by the plane for each flight.
Select the new variable and save it, along with tailnum, as a new data frame object.
Practice
Mutate the data to create a new column that contains the average speed traveled by the plane for each flight.
Select the new variable and save it, along with tailnum, as a new data frame object.
group_by()
summarize() and sample_n() are even more powerful when combined with the idea of “group by”, repeating the operation separately on groups of observations within the dataset.
The group_by() function describes how to break a dataset down into groups of rows.
group_by() does not change anything about the data frame. Rather, it holds the rows of the data frame separately so that any future verbs applied to the data frame are done separately per group being held.
group_by()
Find the fastest airplanes in the bunch, measured as the average speed per airplane.
Chaining
Instead of applying each verb step-by-step, we can chain them into a single data pipeline, connected with the |> operator. You start the pipeline with a data frame and then pass it to each function in turn.
The pipe syntax (|>) takes a data frame and sends it to the argument of a function. The mapping goes to the first available argument in the function. For example:
x |> f() is the same as f(x)
x |> f(y) is the same as f(x, y)
Mornings
Mornings
Morning
(better??)
Mornings
Little Bunny Foo Foo
From Hadley Wickham, how to think about tidy data.
Little bunny Foo Foo
Went hopping through the forest
Scooping up the field mice
And bopping them on the head
Little Bunny Foo Foo
The nursery rhyme could be created by a series of steps where the output from each step is saved as an object along the way.
Little Bunny Foo Foo
Another approach is to concatenate the functions so that there is only one output.
Little Bunny Foo Foo
Or even worse, as one line:
Little Bunny Foo Foo
Instead, the code can be written using the pipe in the order in which the function is evaluated:
Flights
Practice
Form a chain that creates a data frame containing only carrier and the mean departure delay time. Which carriers have the highest and lowest mean delays?
Practice
Form a chain that creates a data frame containing only carrier and the mean departure delay time. Which carriers have the highest and lowest mean delays?
Practice again
Say you’re curious about the relationship between the number of flights that each plane made in 2013, the mean distance that each of those planes flew, and the mean arrival delay. You also want to exclude the edge cases from your analysis, so focus on the planes that have logged more than 20 flights and flown an average distance of less than 2000 miles. Please form the chain that creates this dataset.
Solution
Visualizing the data

Data Wrangling February 5 + 10, 2025 Jo Hardin